Model Runs Assuming Historical Conditions
Filtration services in the context of three historical scenarios are reported below based on model results. Multiple simulations are run in this section based on the 1905 map below.
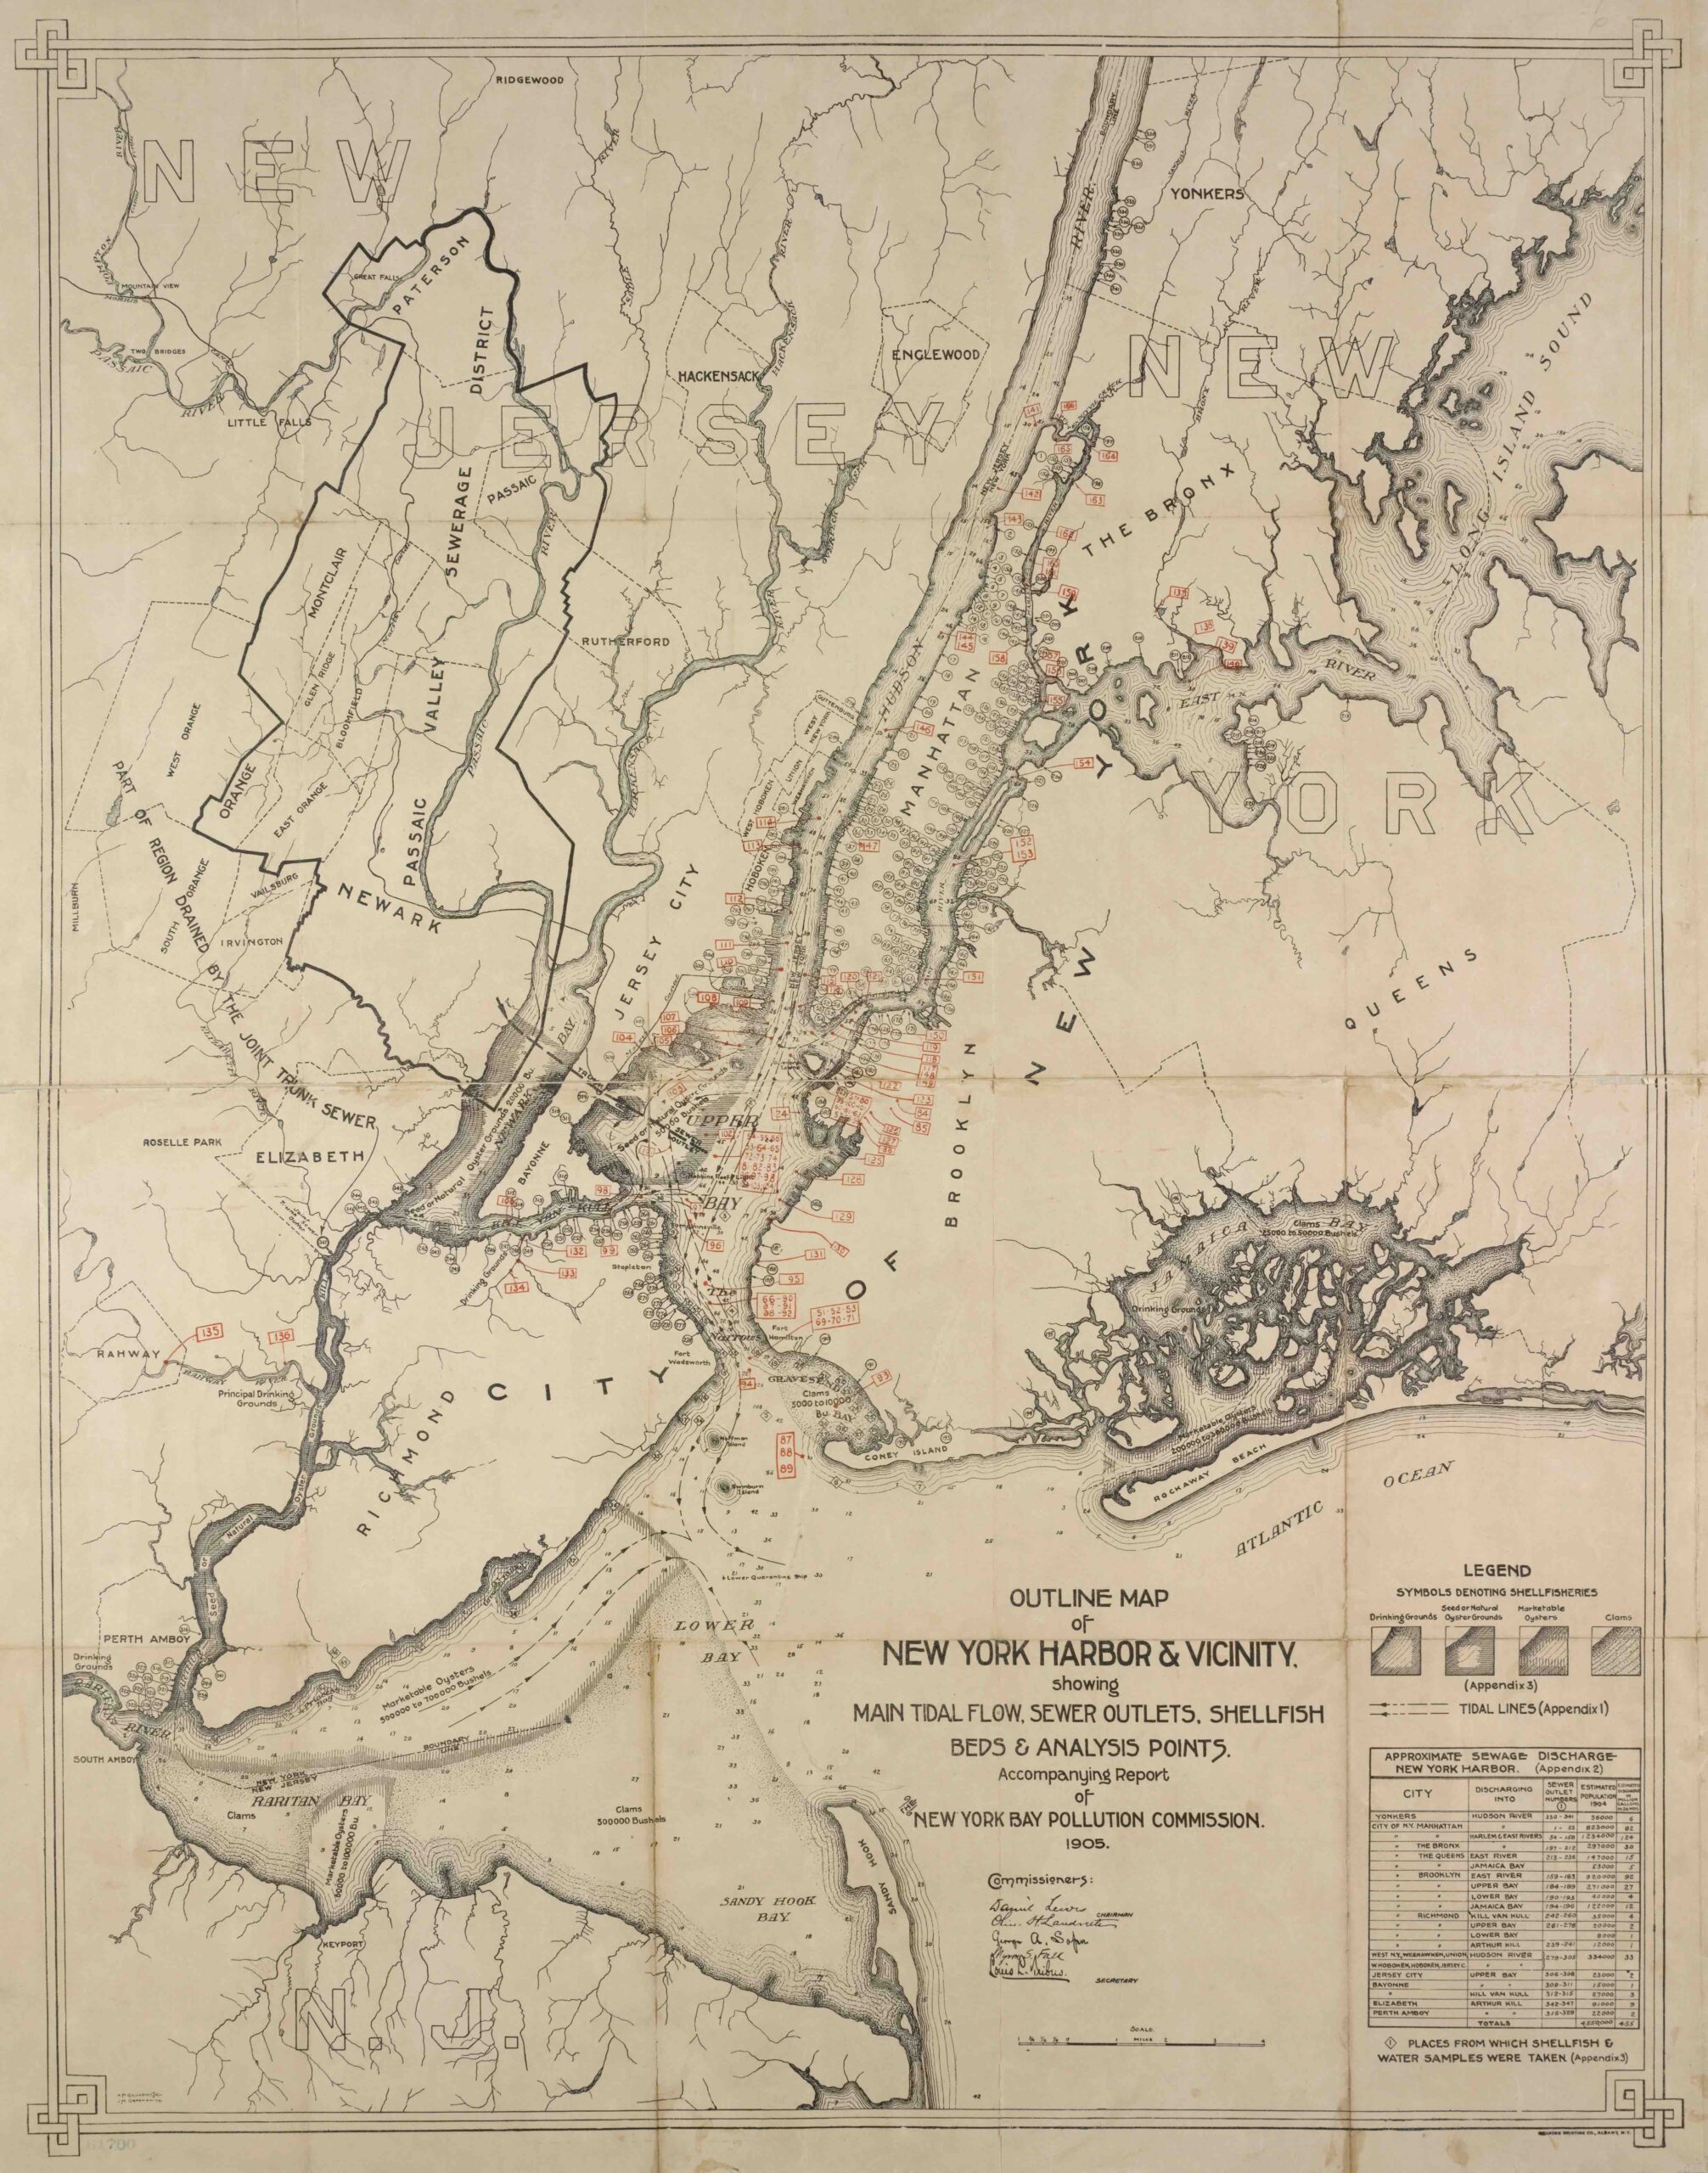
The simulations provided assume a uniform distribution of synthetic pollutants. Pollutants are colored green and are visible everywhere in the subregion at the beginning of every simulation. You will notice the blue outline of the 1905 colony, which is where oysters are present and clear the pollutants as they wash over the colony. As the concentration of pollutants is reduced by oysters, the color changes from green to blue. Pure blue indicates near-zero concentrations of pollutants. First, we assume the 1905 restoration population and location for each of the five colonies indicated in the 1905 map. Click on one of the highlighted colonies below to see a simulation based on the restoration scenario for the region highlighted.
1905 Map Simulations
Below is a simulation at the ecosystem scale where all colonies are restored to demonstrate potential filtration services for the greater NY harbor region.
While the 1905 map provides an admirable restoration goal, there is evidence that conditions were far more favorable for oysters earlier. For example, the highest average oyster density indicated in the 1905 map is 3.9 oysters per square meter. In fact, prior to 1905, the average oyster density was about 17.5 oysters per square meter. Next the simulations are reproduced assuming a higher restoration density of 17.5 oysters per square meter. The expectation is that filtration services will be greatly increased under these conditions.
Historical Density Simulations
Below is a simulation at the ecosystem scale where all colonies are restored under historic conditions of 17.5 oysters per square meter to demonstrate potential filtration services for the greater NY harbor region.
While 17.5 oysters per square meter is a substantial restoration goal, there is further evidence that under “pristine” conditions, these colonies might have included average oyster densities of 1,855 oysters per square meter! Next the simulations are reproduced assuming the pristine density conditions. Certainly one would expect that filtration services are further boosted under pristine conditions.
Pristine Conditions Simulations
Below is a simulation at the ecosystem scale where all colonies are restored under pristine conditions to demonstrate potential filtration services for the greater NY harbor region.