Filtration
Oysters are powerful ecosystem engineers that have transformative effects on their environment. As oysters filter the water column for food and oxygen, they remove and digest some particles, such as algae, and reject or eject other particles like silt. By increasing water clarity, this biofiltration helps improve water conditions for other animals, plants, and humans.
Under natural conditions, how much water will get filtered by an oyster reef? One approach to answering this question is to measure oyster filtration rates in controlled laboratory experiments and then scale up the answer to the natural population size. However, that answer ignores important factors like the residence time of water within a particular portion of the estuary. If we imagine river currents and tides moving algae and silt around, but with a net flow out into the ocean, any particular packet of water (and its load of particles) will only be subject to oyster filtration briefly – maybe a few tidal cycles washing over a particular reef – before it dissipates or is relocated and gone. Thus, a key variable for our question about oyster filtration capacity is tidal water residence time.
The model domain image below allows you to select a region and determine how much water an oyster population in that region would filter if restored there, presented as a percentage of a water ‘packet’ as it ‘resides’ over the reef. The same size oyster population is assumed in each region, so by comparing results you can see differences that are due to water residence time. In other words, all oysters in the model have the same rate of filtration, but their ability to clear particles from the water depends on residence time of that water over the reef. If oyster restoration is motivated by a management goal to filter 10% of the particles, then areas with a short residence time would need more oysters to reach this goal than an area with a longer residence time, all else being equal. Click on a highlighted region to view simulations for filtration in the highlighted area.
Hover your pointer over a region to study. Click to zoom in on that region.
Next we show model runs which are based on the 1905 Map shown below
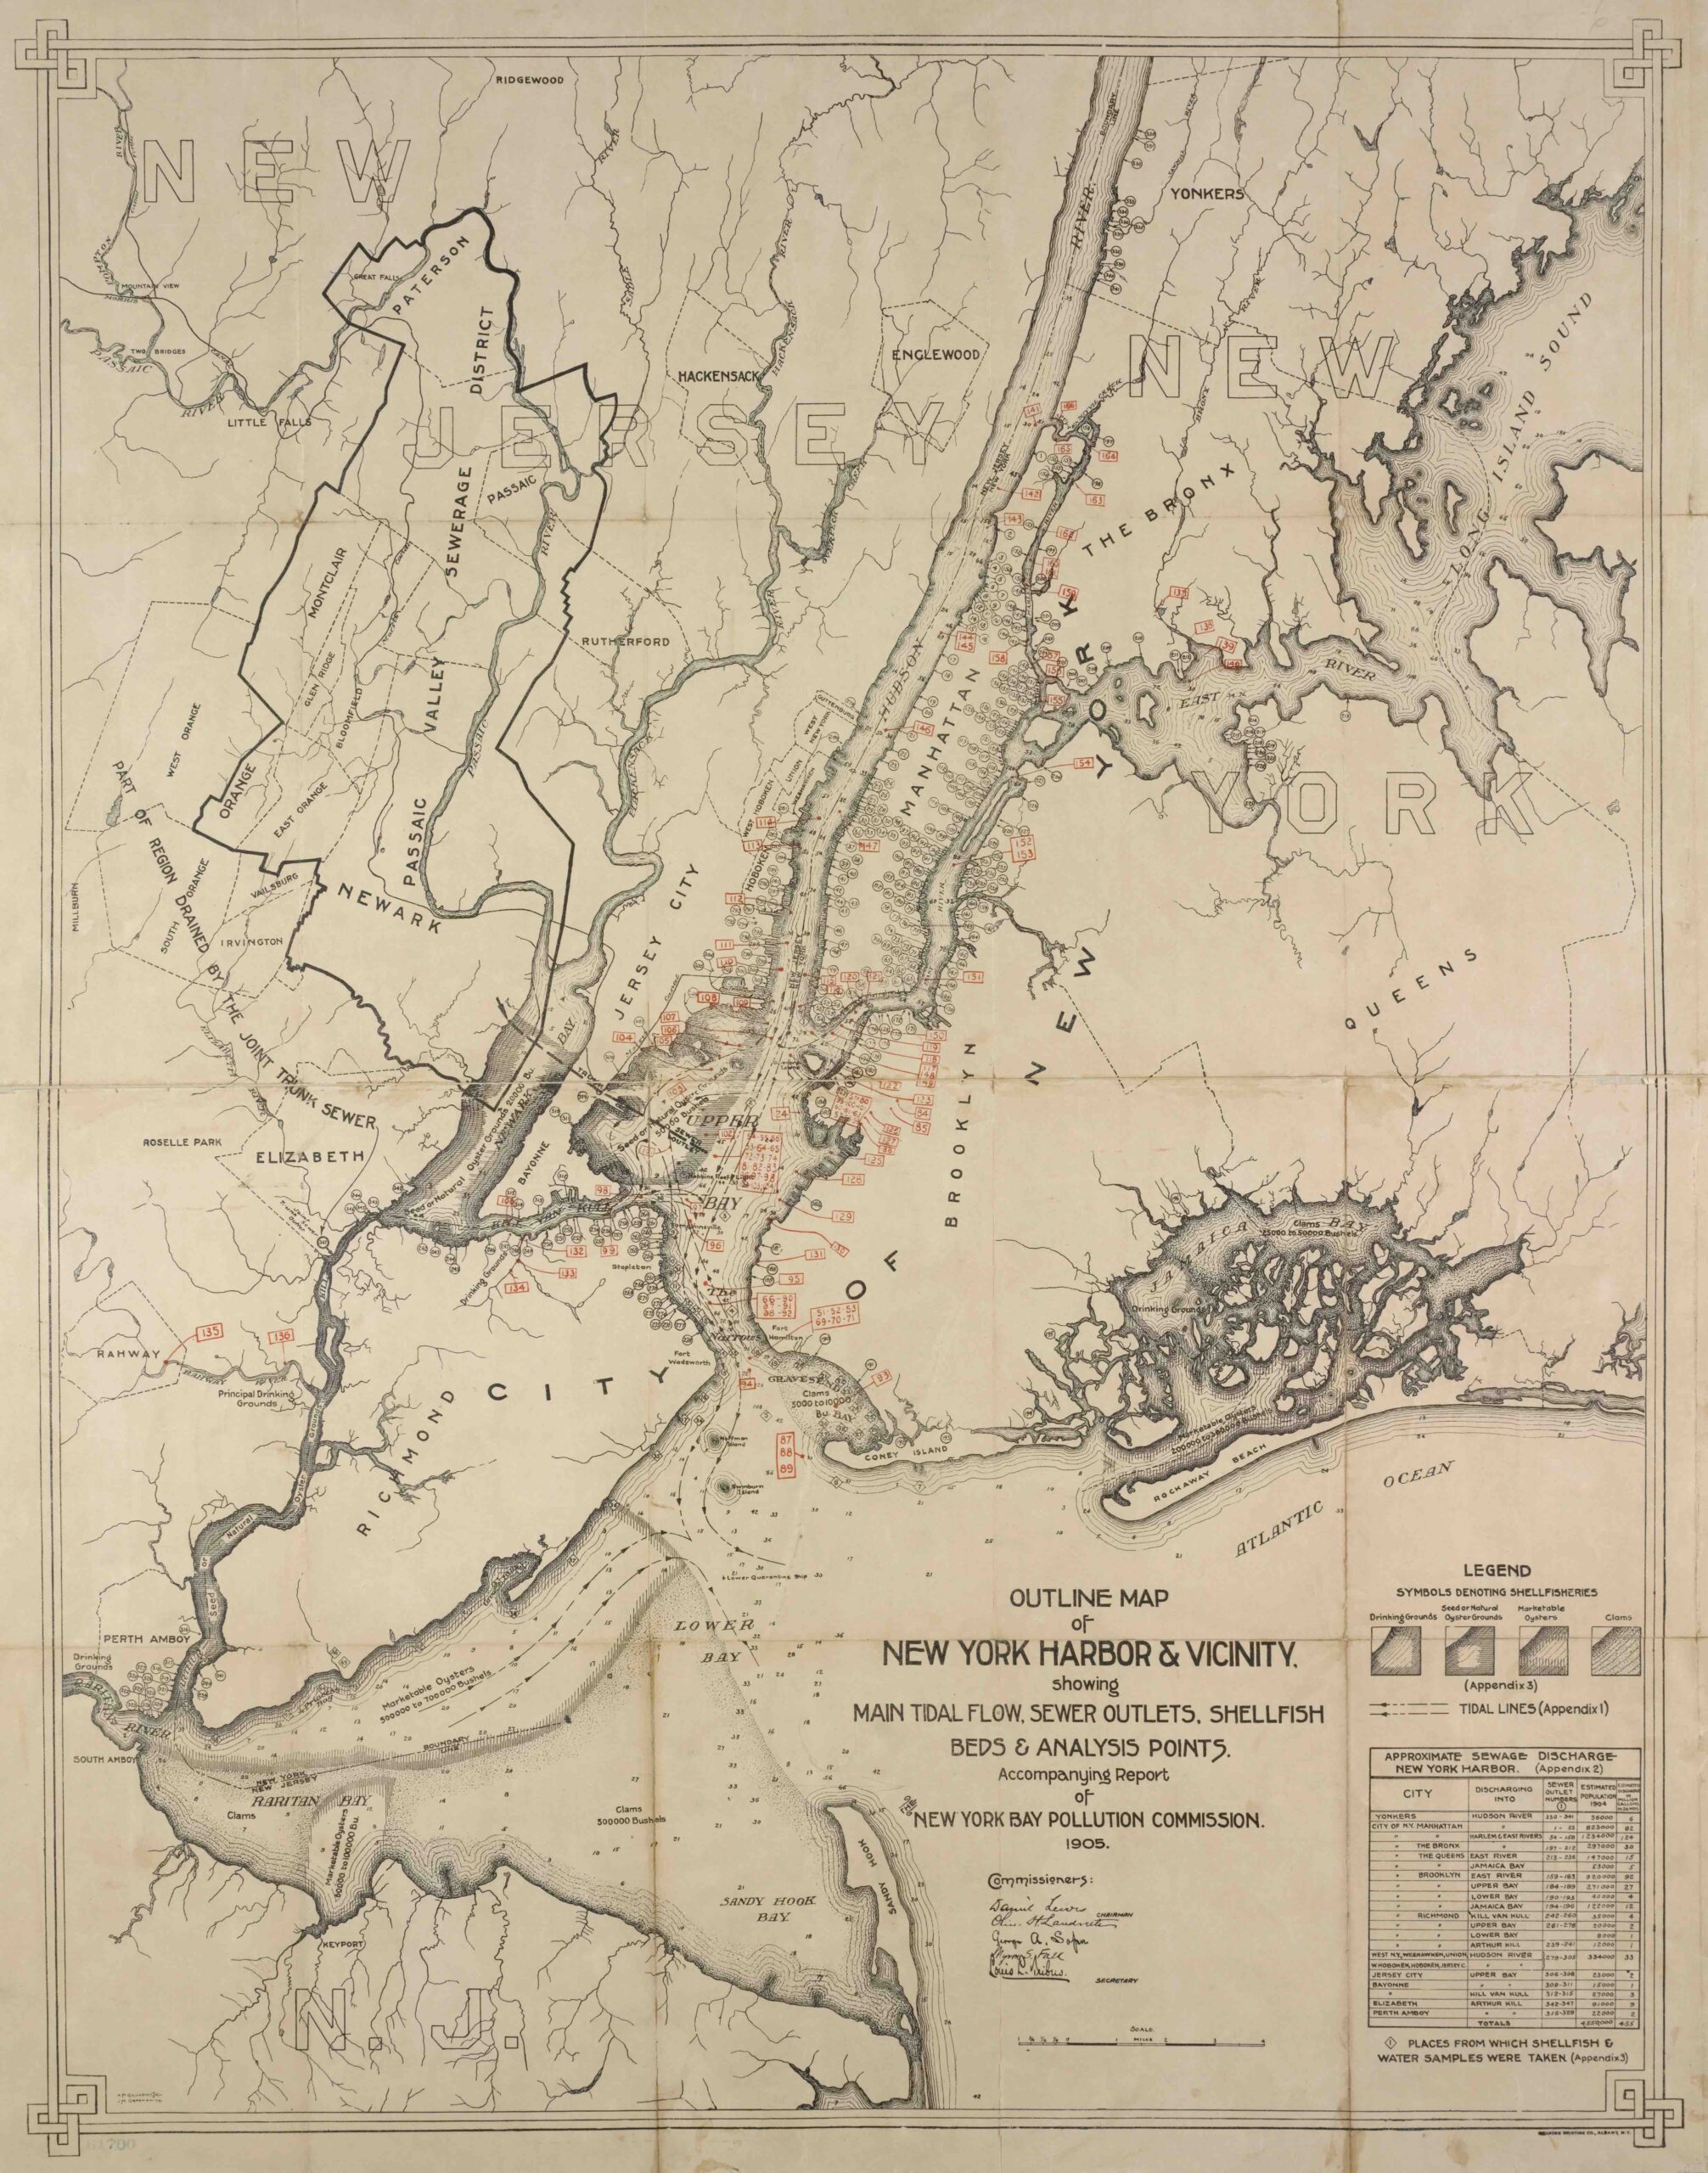
Let’s provide intuition for what factors have a large effect on filtration. First we see a simulation for filtration services based on the 1905 colonies in the Raritan and Lower Bays. These simulations begin with an initial concentration of pollutants everywhere. High concentrations of pollutants are colored green. You will see the blue outline of the 1905 colony, where oysters are present and filter the pollutants when they wash over the colony. As the concentration of pollutants is reduced by oysters, the color changes to blue. Pure blue means there are almost no pollutants present.
Did you notice how the concentrations are reduced as they changed to blue during the simulation? There are several factors that can influence filtration in any given region. The first is oyster density in the colony. If there are more oysters, there will be more filtration! To show you this, here is the same simulation run with a much lower number of oysters in the colony. We might think of this as a sparse colony or maybe an unhealthy colony.
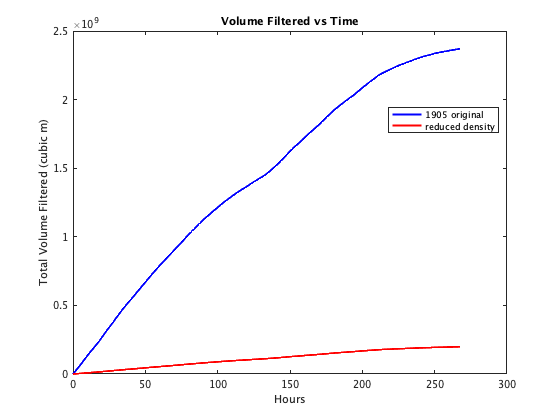
Did you see how much less effective this colony is? We see that much more green remains after the same time period, which informs us that more pollutants remain in the water column. We can make this observation more concrete by looking at the volume filtered over time below. In the blue, we see the first colony, which represents the actual restored 1905 scenario in the Lower Bay. The scenario where the density is reduced by about 80% from the original 1905 density is plotted in red, where we see a similar drop in volume filtered.
A second factor that affects filtration is the time over which the filtration occurs. The residence time in the Lower Bay for the above simulations is about 11 days. That means there are 11 days during which pollutants can be filtered by a colony. The residence time in other regions vary for many reasons. The Upper Bay region has a residence time of about 1 day. In 1905, the Upper Bay included a colony that covered about 1/3 of the entire region. Do you think the filtration will be more or less effective in the Upper Bay if we run a simulation?
If you guessed less effective, then good job! The residence time of 1 day admits far less time during which the colony can filter the water. Therefore the filtration is much lower over the residence time. One might ask what the results would look like if we ran the Upper Bay for the same time period as the Lower Bay, which is a fair question. The problem with this is, we would then have most of the pollutants flushed out of the region after one day anyway. The only way to get more filtration would be to re-introduce pollutants every day. But then 11 times more pollutants would be flushed to other regions. Is this really an improvement? If there were a point-source of pollution in either the Upper Bay or the Lower Bay, it is clear that the point source would be more adequately filtered by the Lower Bay colony due to a combination of hydrodynamics and colony size and density.
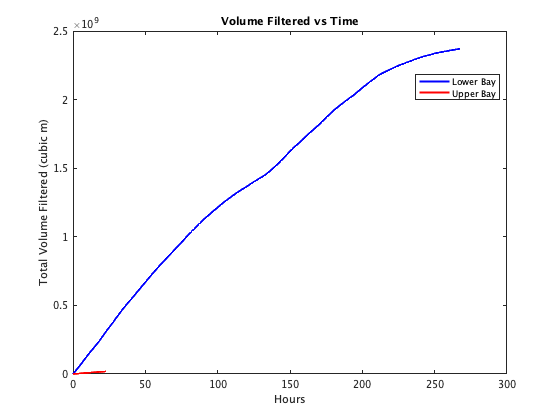
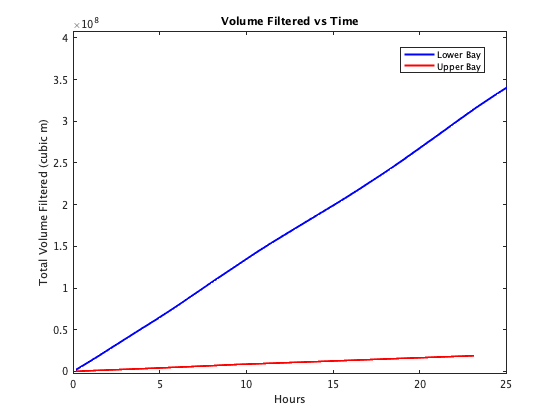
Let’s again check the plot of volumes filtered over time to compare the difference between the Lower Bay and the Upper Bay. Below we see the plot of the volume filtered. The Lower Bay is in blue and the Upper Bay is in red. Notice in Figure 2, the residence time of the Upper Bay being much shorter is quite evident as the red plot finishes after about 24 hours. To make the difference more apparent, see the zoomed in plot on the right (Figure 3) which shows the filtration over only 24 hours.