Education
Table of Contents:
Section 1: Oyster Biofiltration
Section 2: Life Cycle of Eastern Oysters
Section 1: Oyster Biofilration
Oysters once dominated the Hudson/Raritan Harbor
Oysters can typically be found in dense, larger clusters called reefs. The nooks and crannies in the reef are also important homes for animals, such as crabs, mussels, fish, and other organisms like plants.
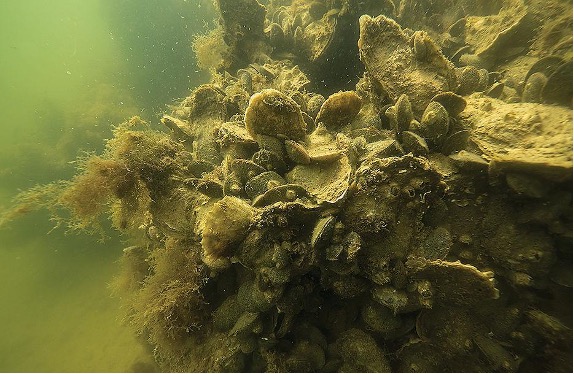
The habitat created by oysters is very important as the alternative is frequently a muddy, barren river bottom. As populations become larger, the gaps between reefs fill in and they can cover huge areas of the river bottom.
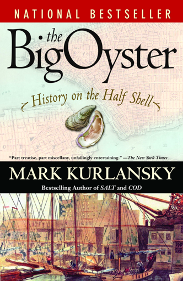
When Euro-American settlers first arrived in New York they sent messages back home describing vast oyster populations composed of individuals as large as a foot in length. There were an estimated 350 square miles of oyster beds throughout the Hudson River and Raritan Bay. Oysters were a prominent feature of the bay; what is now Ellis Island and Liberty Island were referred to by Dutch settlers as Little and Big Oyster Island, respectively. Pearl Street in Manhattan, one of the earliest roadways in the colony, was named for the large shell middens (shell discard piles) made by native Lenape Indians (even though pearls are made by other species of oyster that live elsewhere). More details on the long and important history of oysters in New York City can be found in The Big Oyster by Mark Kurlansky (Fig. 2)
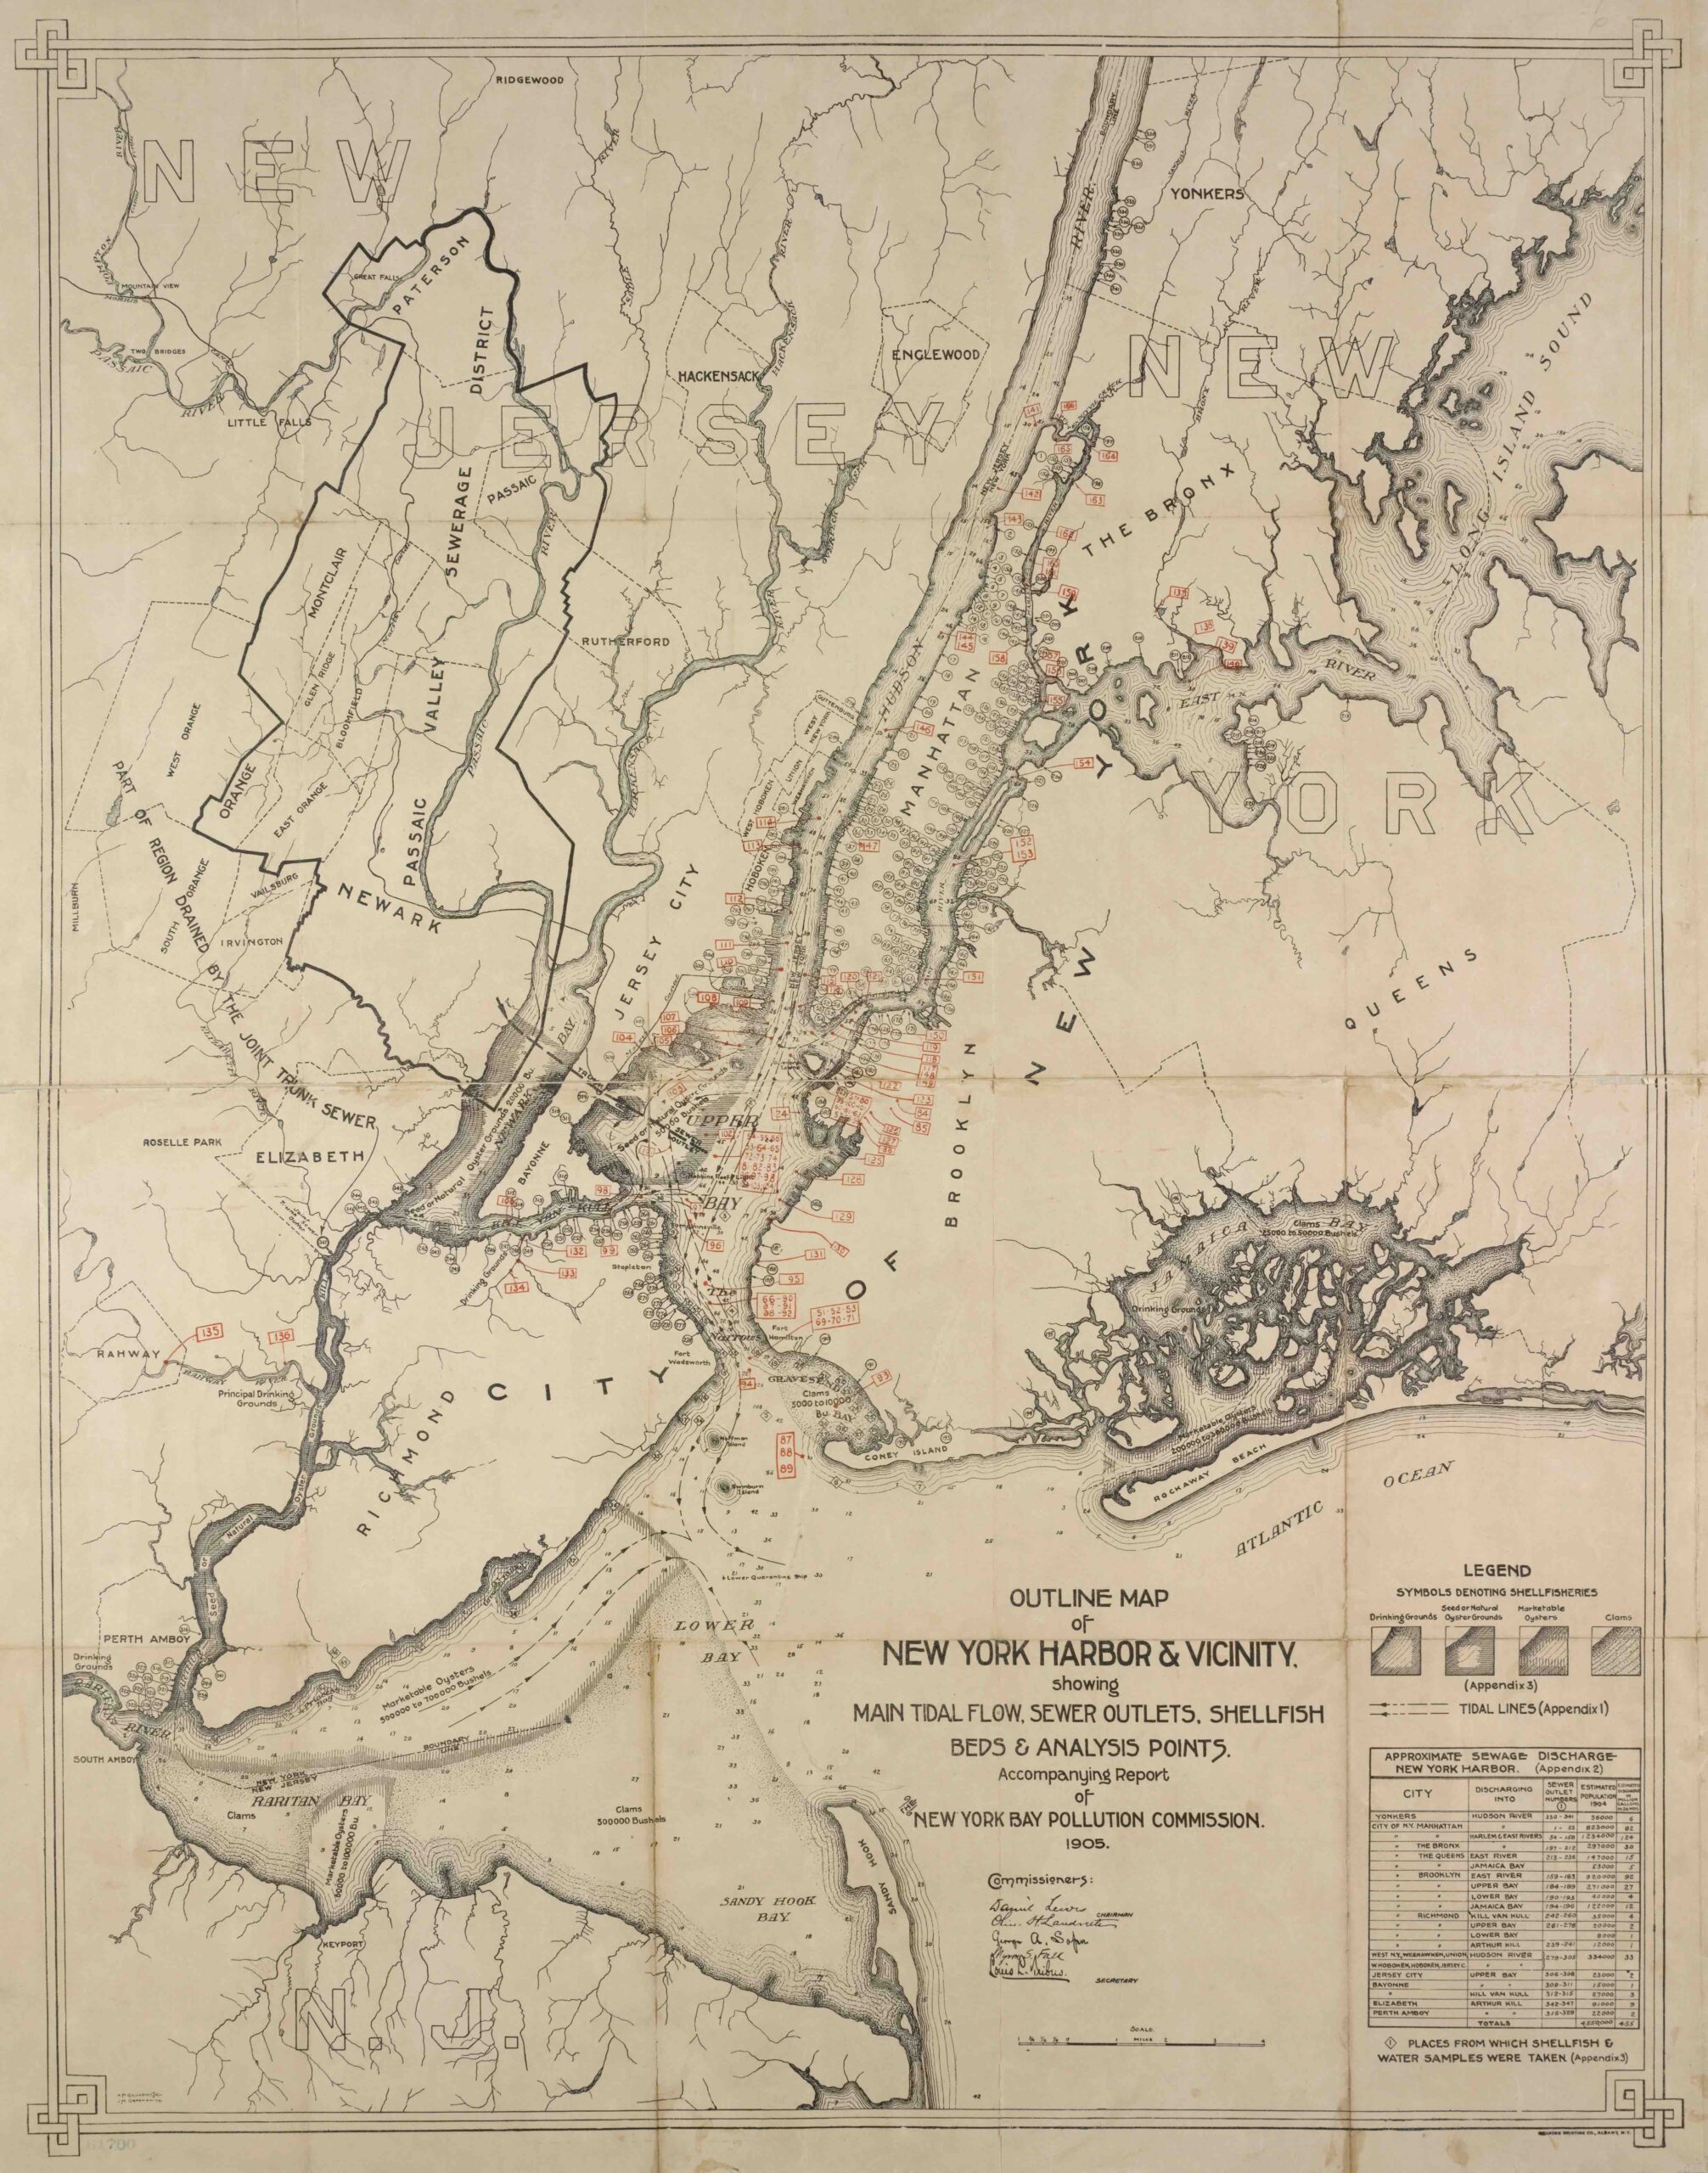
Over time New York City oyster populations declined due to overharvesting, habitat loss, and degradation. However, even as late as 1905, city officials still mapped out extensive oyster populations throughout the Bay (Fig. 3). In fact, this 1905 population provides one of the population scenarios for our model. The city mapped the populations and the locations of sewer outflow pipes as there was concern that contaminated oysters, if consumed, posed a public health risk.
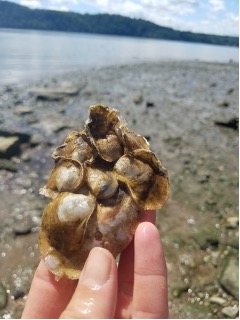
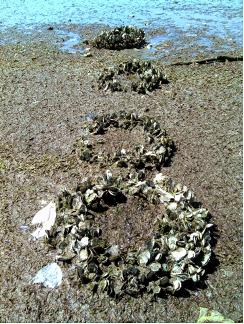
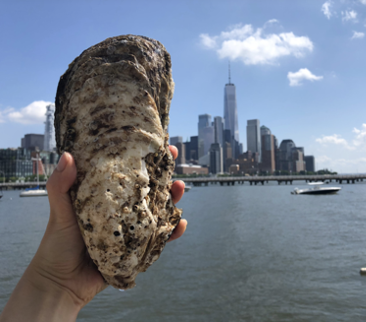
Over many decades, environmental quality has improved in Hudson River and Raritan Bay due to many factors, including modernization of wastewater treatment and new policies that protect the environment. As the water quality improved, signs of oysters rebounding emerged. These signs include finding large individuals (Fig. 4) and recruitment of juvenile oysters, called spat, to rocks and other structures around the Bay.
These signs of renewed life were an encouragement, indicating that the bay could support oyster population growth. Since then the Billion Oyster Project and other programs have worked hard to restore oyster populations, revive their ecosystem services, and educate the public about their aquatic surroundings.
One of the most frequently desired benefits of oyster restoration is the water quality improvement that is derived from their filter-feeding activity. Oysters open their shells and inhale to breathe (absorb oxygen out of the water) and feed on microparticles in the water. But how exactly do oysters filter out useful food?
As oysters inhale the water, they remove and sort particles to either ingest them, supporting shell and tissue growth, or deposit undigestable particles as waste on the river bottom. Either way, oyster populations can remove excess nutrients (due to human waste) from the water, and in the process, make the water more clear so that increased sunlight benefits neighboring plants and animals.
Since the water surrounding oysters is constantly moving, it is very important to understand how oysters interact with the overlying water when estimating their benefits to water quality. Oysters are stationary for most of their life cycle. As oysters sit there feeding, the same river water passes over them repeatedly as the tides carry it in and out, twice a day in the New York region. Each time the same parcel of water passes over them, oysters have another chance to filter portions of this water. Additionally, when oyster reefs cover an extensive area of the bottom, these same parcels of water will likely be further filtered by oysters located in upstream and downstream reefs. Think of a tidal estuary as an intermediate condition relative to a lake, where the same water stays put for a long time. Contrast this with a river where water quickly passes by any location.
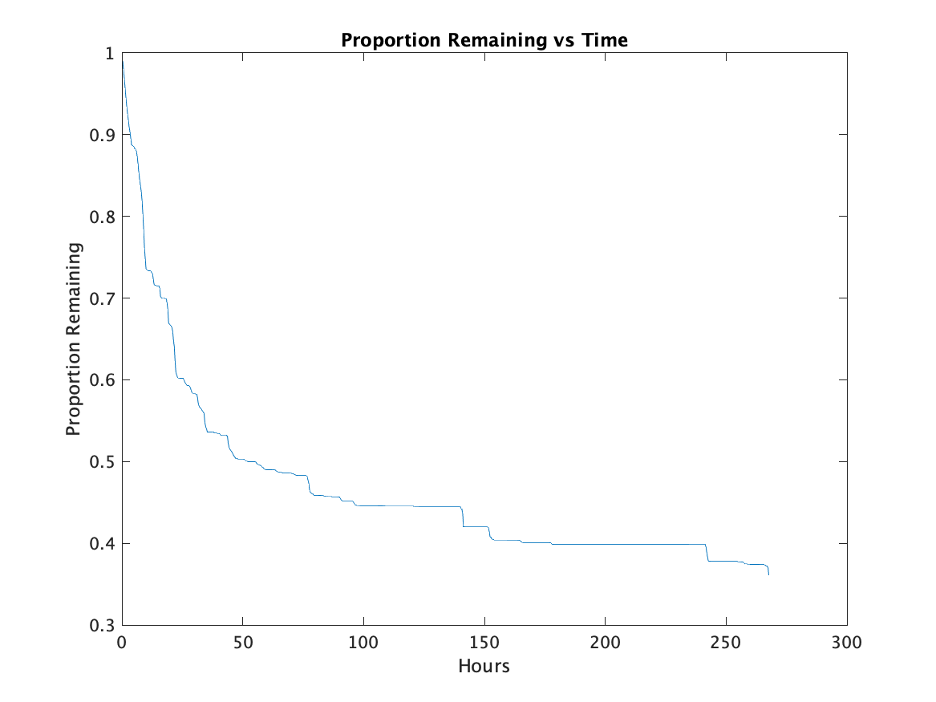
The time water spends in a given area or “domain” and may be fed upon by oysters is called the residence time. A lake has a very high residence time, a river has a low residence time, and in an estuary the residence time depends on many factors including the magnitude of tides, the amount of recent rain, and the direction of the wind. In our model, we account for all these factors and we estimate the residence time of each domain by placing virtual particles in the area and then measuring the time it takes for the number of particles remaining in the domain to decline during the hydrodynamic model run to about 36% of its initial number. For example, the proportion of the virtual particles remaining in the Lower Bay region over time is graphed below. The y-axis indicates the proportion of particles remaining in the Lower Bay. After 267 hours, just over 36% of the particles have been flushed out of the Lower Bay. Thus the residence time for the Lower Bay region is 267 hours.
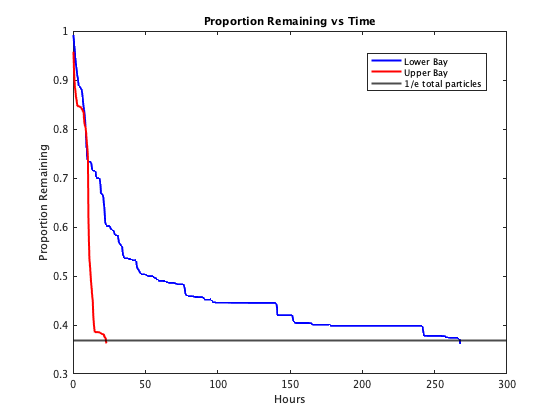
One might imagine that residence times vary by location in the NY harbor. To demonstrate this, see below an image which compares the flushing rates of two different sub-regions. The blue line is the above residence time plot for the Lower Bay. The red is the residence time plot for the Upper Bay, which is much shorter. For reference, the threshold line of about 36% is plotted. One can see how much more quickly particles are flushed out of the Upper Bay than the Lower Bay, which is reflected in a much shorter residence time for the Upper Bay of about 23 hours.
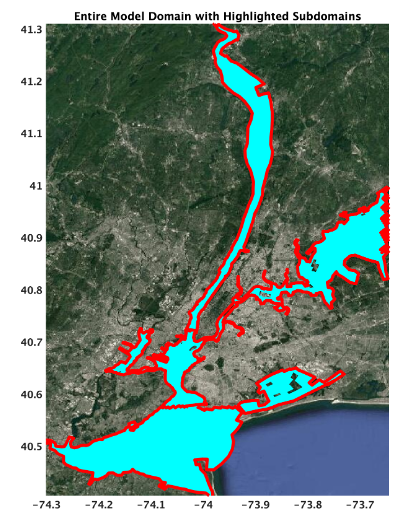
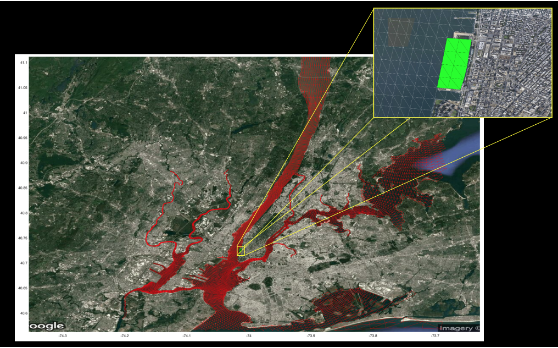
Within each sub-domain there is a mesh grid composed of many triangular cells (Fig. 7). Virtual particles which represent pollutants are again evenly placed in the entire sub-domain. Based upon the model scenario (e.g. how much of the grid is occupied by oysters, prevailing environmental conditions, etc.), the model estimates the proportion of virtual particles filtered from suspension after they enter a cell. The simulation moves the particles according to the hydrodynamics momentarily and then pauses, which is called a time step. The model then identifies the new location of all virtual particles and again estimates the proportion removed by oysters. In our model, 1 time step was equal to 10 minutes of time. Furthermore, to make the model tractable, we divided the entire NY harbor domain into five sub-domains as shown below. These sub-domains include the Hudson River, the Upper Bay, the East River, the Jamaica Bay, and the Lower (Raritan) Bay.
For example, we estimated the transport potential for a small extant colony near pier 26 in the SouthEast Hudson River as seen in Figure 8.
Aside from water filtration by oysters, the concentration of particles is potentially diluted within the domain over time due to fresh river water from upstream or ocean water mixing with the incoming tide. Filtration services is defined here at the sub-domain level as the proportion of water filtered by oysters of the sub-domain within a time interval defined by the subdomain residence time. This provides a simple estimation of the total potential benefit of oyster filtration on water quality in each sub-domain.
There are many additional factors that affect the filtration services of oysters. For example, big oysters filter more than little oysters. Also, oysters feed at faster rates when water temperatures are warm. On the other hand, when environmental conditions decline, for example, a large inflow of freshwater after a rain storm, oysters may close up and will not filter any water. There are good model examples of declines of filtration services from Yaquina Bay in Oregon, USA due to downturns in environmental quality. while temperature dependence is included in our model, these other complexities are not incorporated since we are interested in learning “typical” filtration services. Thus our models provide a good idea of relative potential filtration services among different scenarios.
Refiltration is another important factor. In other words, if water flows out of one domain containing oysters and into another domain with oysters before leaving the estuary, the cumulative filtration effects will be greater than in any one domain. As oyster populations grow in numbers and extent, there is an increasing chance that water will encounter oysters before leaving the estuary and be cleared of particles. For example, models of the large populations in Guana-Tolomato-Mtanzas Estuary in Florida indicated these populations filter a larger proportion of the water (60%) within a residence time and can play an important role in water quality. For these reasons, if filtration services are a goal of oyster restoration, it can be important to restore oysters in areas with long residence times or where oysters will receive water from upstream reefs.
Section 2: The life cycle of Eastern Oysters and why ‘home’ rarely ends up being where an oyster was ‘born’
Motivating questions:
- How many baby oysters does a single female produce per year?
- If a single female can generate millions of offspring, what happens to them all – what proportion of them settle and live on the same reef as Mom?
- What factors control the survivorship and dispersal patterns of oyster larvae?
- If oyster larvae rarely settle on their home reef, but prefer settling near live oysters, then don’t we need to restore a network of living oyster reefs to promote a self-sustaining population in the Hudson River Estuary?
Glossary:
- Estuary – the mixing zone between fresh water flowing down a river and tidal fluctuations of salt water from the ocean.
- Tides – the rise and fall of sea level due to planetary gravitational forces, experienced in an estuary as a sequence of “incoming” tide, momentary slack high tide with no motion, “outgoing tide”, and momentary slack low when the tide turns.
- Metamorphosis – the developmental transition that occurs in some species between an initial form and a later form, for example caterpillar to butterfly.
- Sensory abilities – for humans these are sight, hearing, taste, touch and smell. Some other sensory abilities that have evolved in nonhuman species include echolocation and sensing magnetic fields (magnetoception). Our human nose detects and discriminates among airborne chemicals and we perceive this as “smell”. Many animals and plants have highly developed chemical sensing abilities (even without a nose) and their behavior is modified based on detection of very dilute chemical signals.
- Behavior – the most general definition is for a whole organism response (action or inaction) to an internal or external stimulus.
- Meter – A unit of distance in the metric system, the system used by scientists globally. In the United States nonscientists use the imperial system of units and measure distance in inches, feet, yards and miles. One yard is 0.91 meters.
- Ecosystem engineer – A species that makes disproportionately large impacts on the survivorship or population abundance of other species in a system. For example, oysters build oyster reefs that provide habitat for many other species.
Many animal species have a life cycle of birth-maturation-reproduction-death that includes some parental care by one or both parents. In an evolutionary sense, this parental investment strategy helps assure the success of offspring when they leave home. Leaving home can be risky business for offspring of most species, but dispersing away from home is also important to find unused habitat and avoid competition for resources. Also, sometimes dispersal is not just about changing location, but also about taking advantage of abundant resources elsewhere, like salmon dispersing to the ocean and returning as adults to breed in their river of origin. Thus, most animal species have a characteristic life cycle that includes dispersal after parental care or after some period of growing bigger. Other species have arrived at quite a different strategy in which offspring are sent on their way immediately after sperm fertilizes an egg to make an embryo. This strategy is seen in many marine invertebrates that release gametes into the water column (“broadcast spawning”) so that fertilization is external to the animal. Some oyster species display this life history, including the native eastern oyster that we focus on here.
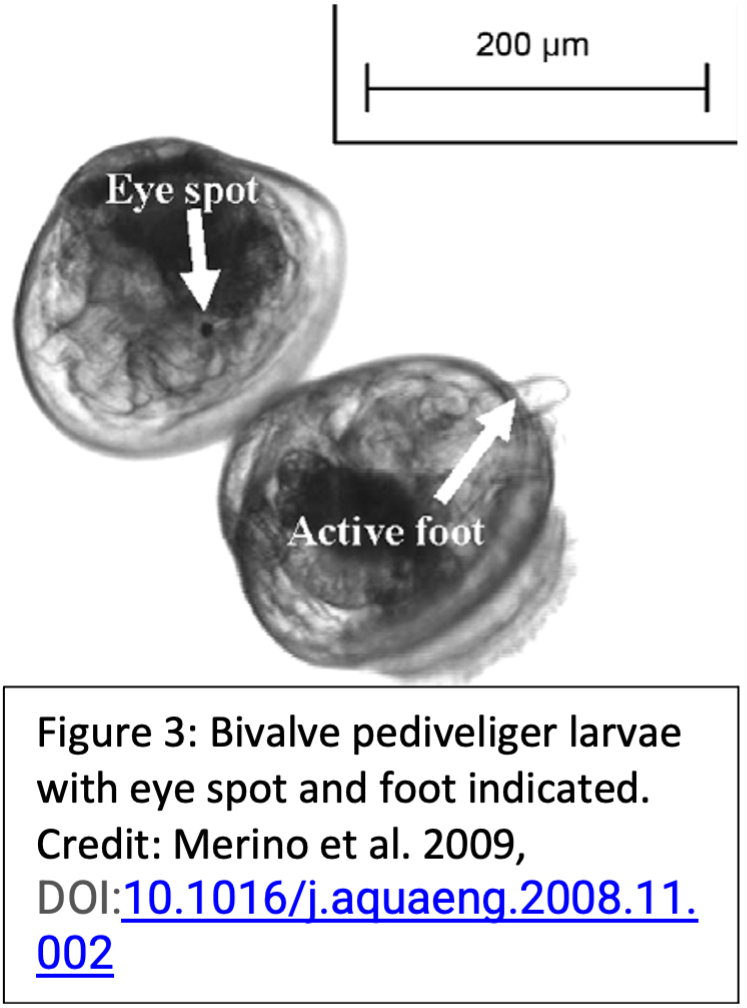
Oyster Reproduction: Eastern oyster females produce millions of eggs that they spawn into the surrounding water (Fig. 1). [MPH1] Male and female oysters can chemically detect the spawn of nearby oysters as it floats by and it triggers spawning. Because this chain reaction puts a lot of gametes into the water at the same time, union of eggs and sperm – fertilization – is more likely to generate tiny oyster babies – zygotes – that float away. Rapid zygote cell division, fueled by the nutrients that mom stored in her eggs, leads to D-shaped larvae in ~2 days (Fig. 2). Multiple transitional larval stages develop over 2-3 weeks, each with an extendable filter-feeding appendage so that larvae can feed on microalgae (phytoplankton). This larval life stage is referred to as planktonic – marine drifters who cannot swim against a current. For a short period the oysters become part of the zooplankton (animal drifters like copepods and jellyfish) and contribute to an essential lower level of the food chain, phytoplankton -> zooplankton -> consumers like fish and baleen whales -> top predators like sharks and killer whales. For oysters, the final developmental stage includes appearance of an “eye” spot and growth of a muscular “foot” (Fig. 3), and includes a change in behavior as larvae swim to the bottom.
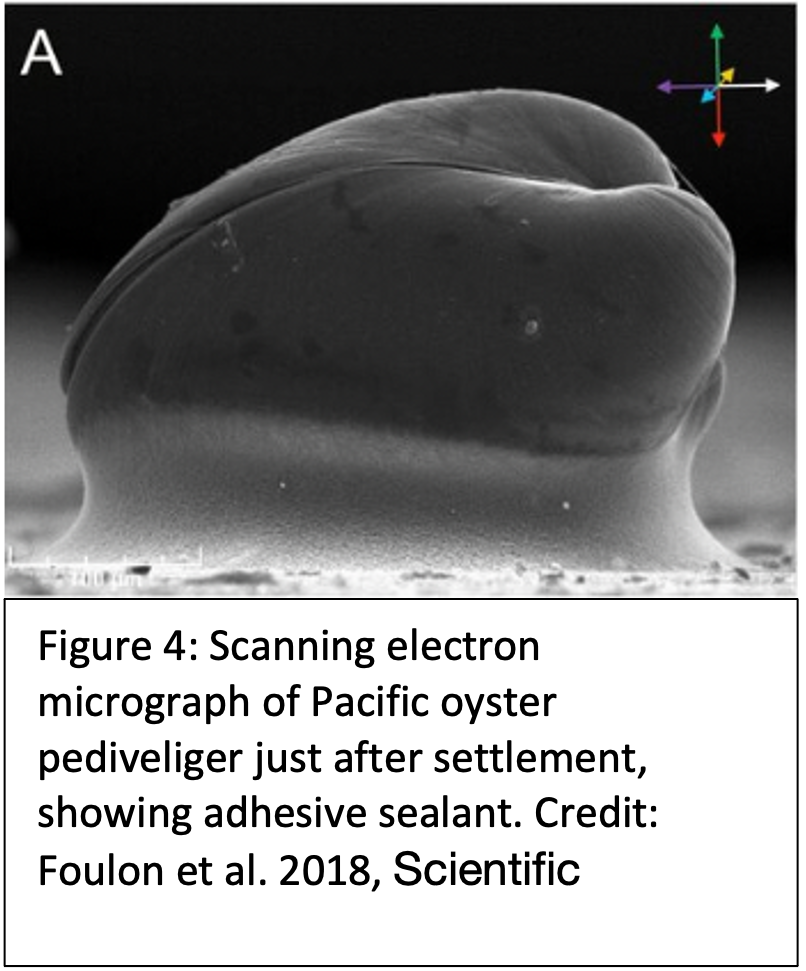
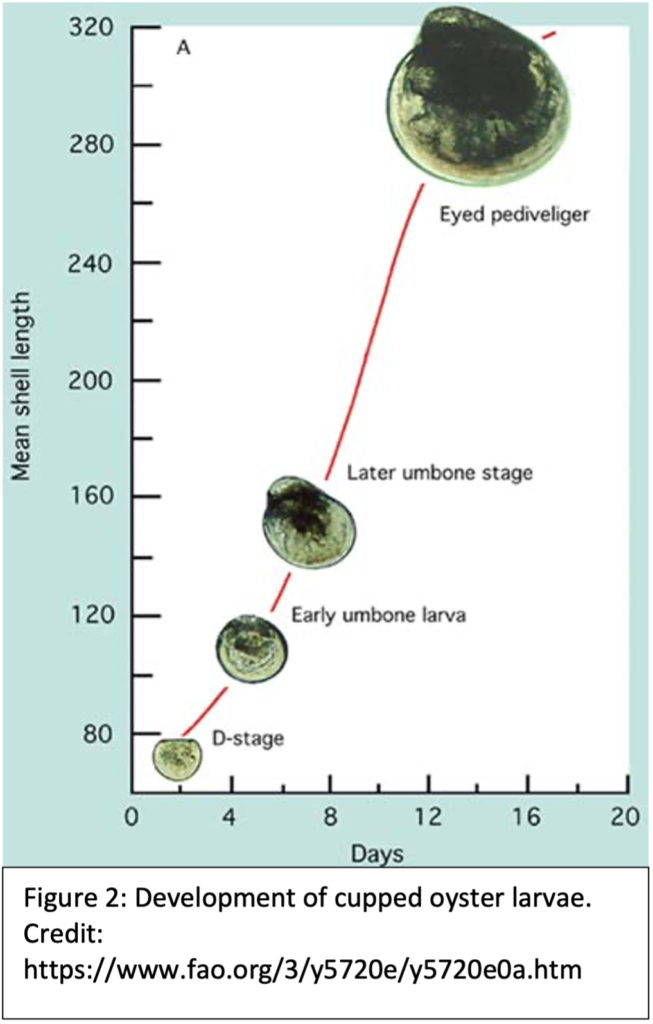
To find a permanent home, the foot and other sensory mechanisms are used to choose a settlement location, where the shell is cemented down (Fig. 4) and the body transforms – metamorphosis – into the body plan we recognize in adult oysters at the oyster bar.
Larval Dispersal: Eastern oyster larvae are not just floating around willy nilly, completely at the mercy of the tides in estuaries where they live. Existing scientific data suggest thatEastern oyster larvae are initially buoyant, meaning that embryos and early-stage D-larvae float to the surface like a cork. As they grow larger their capacity to ‘swim’ increases, not enough to fight the tide, but enough to slowly move vertically. Using their feeding appendages as paddles they move down from the surface to position themselves near a key vertical transition point between layers of water. Fresh water has a lower density than salt water, so as fresh water flows down river it tends to stay at the surface in an estuary, while high tide pushes a wedge of denser salt water up-estuary along the estuary bottom. The resulting vertical layering of water, stratified by density, is a common characteristic of estuaries. Oyster larvae are believed to be sensitive to the sharpest transition point between these two layers, where the top freshwater layer is primarily moving downstream relative to the bottom salty layer. At this position just a small amount of vertical swimming can make a big difference in the upstream/downstream destination of larvae (see larval transport videos under “Transport”).
The sensory and paddling abilities of marine larvae, in addition to the characteristic swimming behaviors for each species, are diverse. In most cases these behaviors are assumed to be adaptive (i.e., improve individual survival and maximize access to nutrients for growth). For example, oyster larvae with the ‘wrong’ swimming behavior could easily get flushed out to sea where oysters rarely live long enough to reproduce, therefore contributing fewer genes to the next generation relative to an individual whose behavior maintained them in good estuarine habitat.
Some other species, like some estuarine crabs, have evolved larval behaviors that encourage flushing out to the ocean, where feeding conditions are generally good, then weeks later they “ride” the tide back into the estuary where the only good settlement habitat occurs. Scientists find it very challenging to study and learn the details of larval sensory and behavioral adaptations, but overall it is clear that larvae are not simply passive particles at the complete mercy of the tides. One approach is to drag a plankton net through the water at specific depths and at specific parts of the tide cycle to characterize where larvae of a particular species are aggregating at different larval ages. Because larvae are so hard to find in nature, and can be difficult to identify at the species level in the complex mix of plankton collected, the more common method of investigating larval behavior is to spawn adults in a hatchery to produce larvae and then study their behavior in artificial water columns using video analysis.
Billions and Billions of oysters: The magnitude of oyster reproductive capacity is mind boggling. When the Billion Oyster Project succeeds in planting a billion oysters – and let’s say they all remained alive at one time – that might represent half a billion females (assuming a 50:50 sex ratio). By chance maybe half of the females spawn in any one year, say a quarter billion females (0.25 x 10⁹ ; read this as one quarter with the decimal point moved to the right nine digits, or ¼ x 1,000,000,000 making 250,000,000). The number of eggs a female oyster spawns increases as she grows, and easily reaches 10 million eggs per year per female! Assuming a broad range of female sizes, let’s assume an average of 1 million eggs spawned per female. Males are usually nearby on the reef contributing lots of sperm, but perhaps only one tenth of eggs are successfully fertilized by sperm because of rapid diffusion of gametes after spawning (they drift apart). How many oyster babies are produced in a single year?
(spawning females) * (eggs fertilized) = # zygotes produced
(0.25 x 109) * (0.1 x 106) = 2.5 x 10¹³
25,000,000,000,000 or 25 trillion babies!
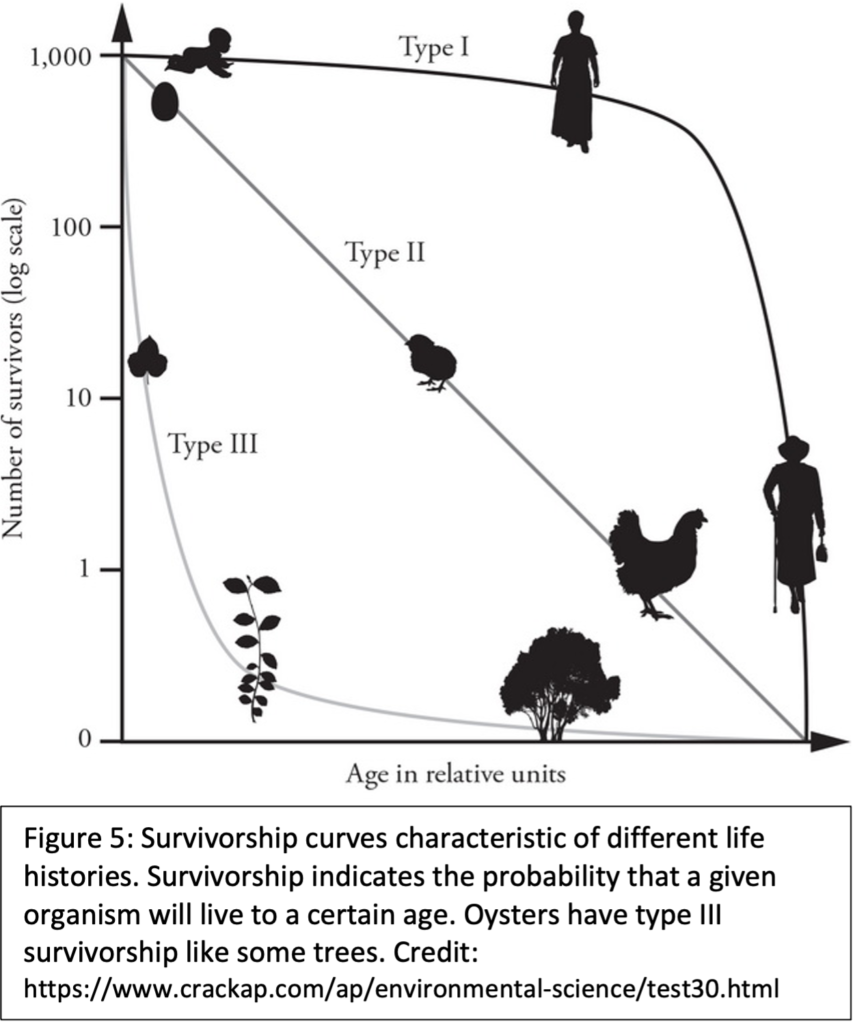
If none of the babies died we would quickly be overrun with oysters! In fact, there are a lot of factors that collectively limit larval survivorship both in the plankton and soon after settlement, even in a healthy estuary. Evolutionary ecologists hypothesize that the life cycle strategy of heavy parental investment in a few offspring, like in humans, is adaptive for species inhabiting a relatively stable environment because it increases early survivorship (Fig. 5). In contrast, estuaries are extremely dynamic and quality habitat is patchy. Under these conditions producing lots of offspring, each one inheriting a different combination of traits and abilities from mom and dad, and each one receiving a miniscule parental investment (nutrients in the egg), is an adaptive strategy for getting your genes into the next generation (but entailing huge risks for any one larva).
The oyster dispersal lottery: Oysters are more successful if they settle and grow on an existing oyster reef. Recent experiments have demonstrated that in nature, when oysters have a choice between setting on shell 200 meters from a living reef, versus on the reef itself, they favor settlement on the reef nearly twice as much. In the experiment, clean shell at increasingly longer distances from the reef experienced diminishing larval settlement.
This makes adaptive sense – why try to ‘go it alone’ and test a new location if you can find an existing ‘proven’ reef as evidenced by living oysters? Oyster larvae cannot hunt for good settlement locations during their entire 2-3 week dispersal phase. For one, they are not near the bottom for most of that time. Second, they are only physiologically competent to settle and metamorphose at the end of that period. They can only “choose” among the sites they encounter when competent. If only one oyster reef exists in an estuary, and all the babies produced at that reef are floating around for 2-3 weeks, few individuals will happen to find themselves near their source reef when the time comes to choose a home. For this reason, a single reef or just a few reefs is typically not a self-sustaining system within an estuary. Oyster larvae that don’t find a reef may still settle on something hard (shoreline bulkhead, rock, piling), but there is a much lower probability that they can successfully grow, and they will not have many neighbors for spawning to result in fertilization.
Researchers often do restoration experiments at a few small artificial reefs to test methods and measure local ecological benefits from the oysters, but when it comes time to scale up and build a sustainable network of reefs, details matter and spatial scale matters. For example, researchers have found that larval dispersal patterns are typically non-random within an estuary. That is, the interaction of tides, currents and larval behavior generates characteristic dispersal patterns within a particular estuary that make settlement more likely in some places vs. others, even if settlement substrates were of equal quality everywhere. Thus, decisions about where to restore a habitat patch by improving settlement substrate can benefit from knowing where oyster larvae are most likely to end up when competent. Also, because we want restored reefs to reciprocally send babies to each other, as well as have some larvae return “home”, larval dispersal patterns provide an important spatial design criterion when planning restoration strategies. Three-dimensional computer modeling of the estuarine water movements and larval behavior is sometimes used to predict where larvae are most likely to disperse and settle within an estuary, providing clues about optimal restoration reef locations. In some cases historic reef sites also provide information about where a reef had previously been successful, but if shoreline or bottom modifications have altered water flow patterns then historical reef location may no longer be relevant. See the model results under “Transport” as an example of modeling larval dispersal.
The road to successful oyster population restoration: It is a common challenge in conservation biology that when population size (abundance of individuals) drops relative to the size of historically healthy populations, recovery is not as simple as simply adding more individuals to remnant populations or providing more habitat. Sometimes there is a complicated relationship between population abundance, the spatial distribution of populations, and key biological processes like finding unrelated mates, or finding good habitat. Thus, restoration gets especially challenging as more of the original population gets destroyed. For example, a population size reduction to 10% of the original size might be expected to make for a 10x challenge to achieve full recovery, but instead it is often 50x or 100x harder to build the population back, at least until some threshold population size is achieved. Of course, restoration also is challenging because species do not live in isolation – there are ecological interdependencies among species, and the environment needs to be restored along with the species. However, species like oysters – ecosystem engineers – can have an especially high impact moving the whole system toward recovery. As oyster settlement builds up a complex reef structure, it supplies habitat for many other species. Also, as oysters become more abundant their eating habits – filtering microalgae from the water column, can improve water quality in ways that help other species (see Education -> Filtration materials on this website). These ecological dependencies make oysters a keystone species for system recovery, and an excellent target species for initial restoration efforts.